RSS

Condo Market at odds with Recent BC Property Assessments

Condominium owners in Metro Vancouver are opening up 2019 property-assessment notices showing increases in value from a year ago. But much has changed in property markets since B.C. Assessment set those values on July 1.


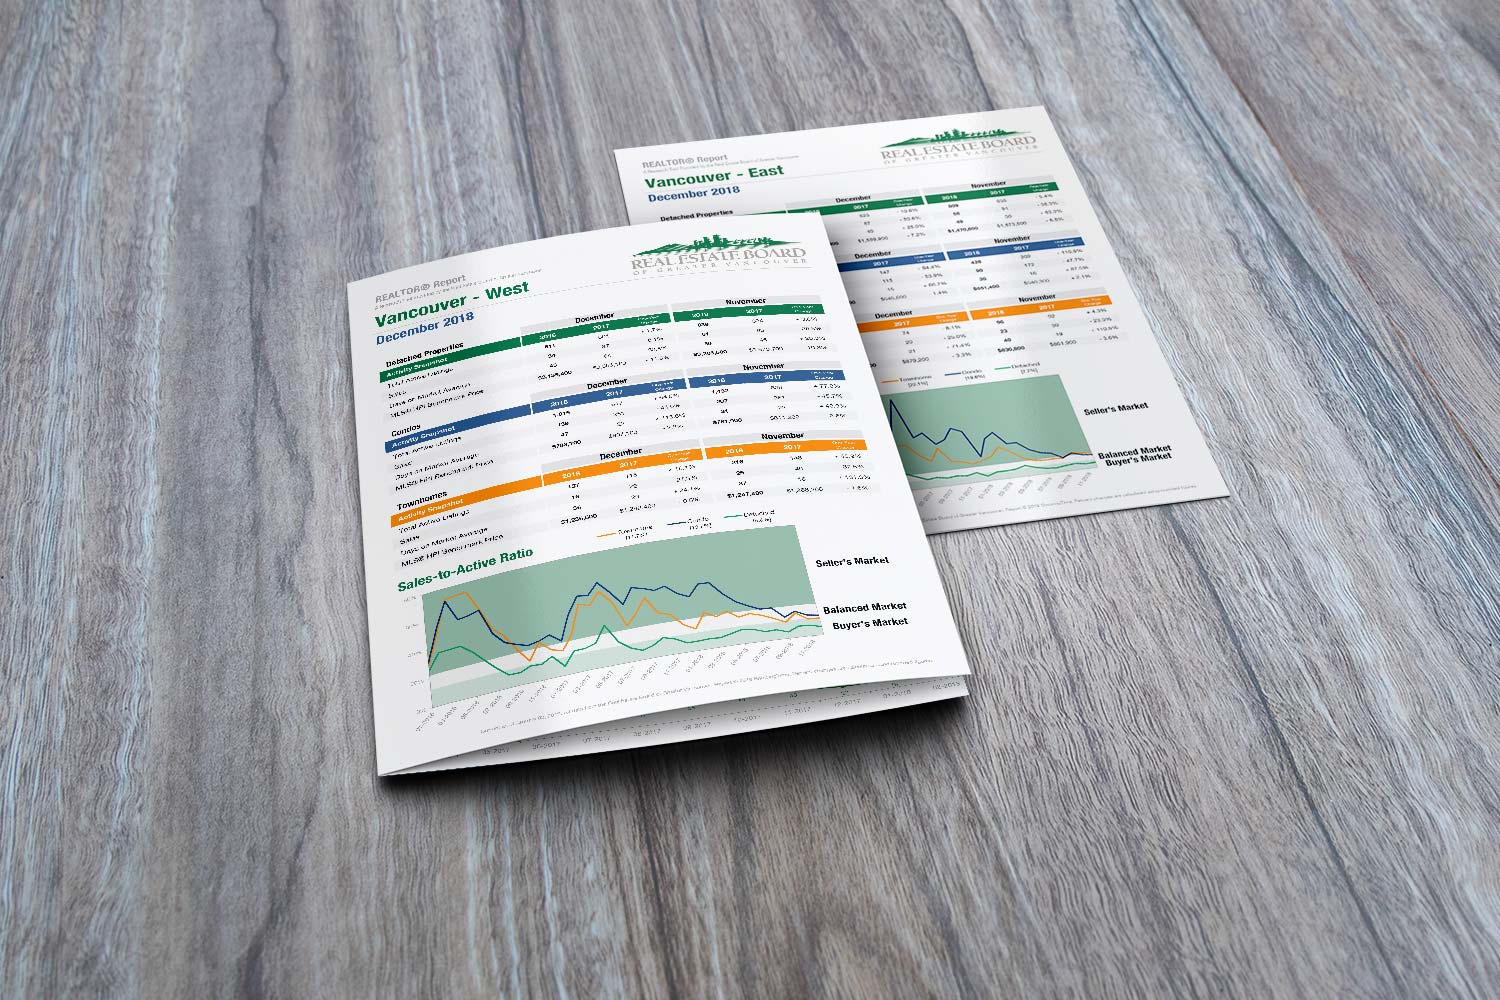
Across most of Metro Vancouver, condo prices are down 6.4 per cent since July to a benchmark prices $664,100, according to figures released Thursday by the Real Estate Board of Greater Vancouver. The benchmark is based on the average price, adjusted to reflect “typical” condos among those sold.

That is in contrast to B.C. Assessments’ July 1 appraisals that showed average increases from July 2018 of anywhere from six per cent in the city of Vancouver to as much as 23 per cent in Whistler, while assessments on less affordable detached homes were down four per cent in Vancouver and North Vancouver and as much as 12 per cent in West Vancouver.


"Since then, the numbers suggest a broader decline in the market,” said Bryan Yu, deputy chief economist with Central 1 Credit, with sales and prices for condos trending lower along with detached homes.

“This year, when (municipal property) taxes roll around, you’re going to see condo owners take a little more of a hit in terms of their taxes, relative to single-family,” Yu said.


Yu said sales figures show that the condo market became “red hot” in 2016 as detached-home prices soared out of the reach of many buyers, pushing them into the strata-property market. That trend lasted through 2017 and into 2018.


Now, factors such as higher mortgage interest rates and stiffer mortgage-qualification rules have reduced the spending power of buyers and cooled demand at all levels of the market, Yu said.


“In terms of the overall Lower Mainland, our view, at least for benchmark prices, is that they’re already down six per cent (for condominiums),” Yu said. “We see another up to four or five per cent more decline in the broader market (in 2019).”


The Real Estate Board of Greater Vancouver said on Thursday that 24,619 sales were recorded through MLS for all of 2018, a near 32 per cent decline from 2017. Within that, condo sales represented 12,771 transactions, a 30 per cent reduction.


And since July, in Metro Vancouver submarkets, benchmark condo prices have declined as much as 14 per cent in Squamish (now $455,900), 10.3 per cent in Port Moody (now $627,300), 6.3 per cent on Vancouver’s east side (now $538,000) and seven per cent on Vancouver’s west side (now $783,700), according to real-estate-board figures.


For the B.C. Assessment Authority’s assessors, such changing markets don’t create a big challenge, said regional assessor Tina Ireland, because their task is to provide a snapshot of property values on July 1.

“The reason why we do that is so the same market conditions apply to everyone’s assessment,” Ireland said, “to determine a property owners’ share of property taxes in their community.”


However, Ireland said it can be “a bit more of a challenge” explaining assessments to property owners who might be opening their assessment notices and saying “my property is no longer worth that.”


B.C. Assessment took about 1,000 calls from the public on Wednesday, the authority’s first business day since assessments were made public Dec. 31, which is a 60 per cent increase from 2017, Ireland said, but it is difficult to know how big a factor the declining market values is in those inquiries.


For those homeowners who have questions, Ireland suggested consulting the authority’s website for more information about their assessments. It also has tools to compare assessments.


If homeowners have more questions, Ireland said they can call B.C. Assessment for an explanation, and if they are still not satisfied, have the right to appeal their assessments. The deadline to file an appeal is Jan. 31.


Read

What if I believe that my Property Assessment is Incorrect?


Dear friends and valued clients;


By now, most of you have received your Propery Assessments for 2019.  Many of your assessed values are incorrect as the data was compiled back in July 2018.  The real estate market has shifted and many of the assessed values are  over inflated.  


If you feel that your assessed value may be incorrect, you have options.  


-  Firstly, contact me for updated value of your home.  I'd be happy to propvide this at no cost or obligation to you.  


-  Secondly, contact the BC Assessment Office at 1-866-825-8322 or 604-739-8588 to discuss your Assessment. 


-  If you still feel that your Assessment is incorrect, you may file for a Notice of Complaint (appeal) for a formal hearing with an Independent Property Assessment Review Panel. The Notice of Complaint Form (appeal) can be found online at www.bcassessment.ca.   A complaint (appeal) must be filed online, by mail, or delivered in person to your local BC Assessment Office.  


Hearings are heard between February 1st to March 15th, 2019.  A notice of hearing will be sent to you approximately 5 days prior to your hearing. 


Again, please note that the Deadline for Filing a Complaint (Appeal) is JANUARY 31, 2019.  

Read

Real Estate Board of Greater Vancouver December 2018 Market Stats
The December 2018 Market stats are out and available for download. You get the following graphs and charts for both Vancouver East and Vancouver West.
  • Activity Snapshot by PropertyType
  • Detached Properties Report and Graph
  • Condo Report and Graph
  • Townhomes Report and Graph
  • Benchmark Price Graph
  • Average Price Per Square Foot
If you are interested in a report like this is for other areas, please contact me to request it and I'll send it to you.
 
Read

Metro Vancouver home sales decline below historical averages in 2018
VANCOUVER, BC – January 3, 2019 –Metro Vancouver* home sales in 2018 were the lowest
annual total in the region since 2000.
 
The Real Estate Board of Greater Vancouver (REBGV) reports that sales of detached, attached and apartment properties reached 24,619 on the Multiple Listing Service® (MLS®) in 2018, a 31.6 per cent decrease from the 35,993 sales recorded in 2017, and a 38.4 per cent decrease compared to the 39,943 residential sales in 2016.
 
Last year’s sales total was 25 per cent below the region’s 10-year sales average. “This past year has been a transition period for the Metro Vancouver housing market away from the sellers’ market conditions we experienced in previous years,” Phil Moore, REBGV president said. “High home prices, rising interest rates and new mortgage requirements and taxes all
contributed to the market conditions we saw in 2018.”
 
Home listings in Metro Vancouver reached 53,614 in 2018. This is a 1.9 per cent decrease compared to 54,655 homes listed in 2017 and a 6.9 per cent decrease compared to the 57,596 homes listed in 2016.
 
“The supply of homes for sale will be an important indicator to follow in 2019. We’ve had record building activity in recent years and many projects will complete soon. This will provide additional housing options for home buyers across the region,” Moore said. The MLS® HPI composite benchmark price for all residential homes in Metro Vancouver ends the year at $1,032,400. This is a 2.7 per cent decrease compared to December 2017.
 
“As the total supply of homes for sale began to accumulate in the spring, we began to see downward pressure on prices across all home types throughout the latter half of the year,” Moore said.
 
The benchmark price of detached homes in the region declined 7.8 per cent over the last 12 months and 7.3 per cent since June 2018. Apartment homes increased 0.6 per cent over the last 12 months and have declined 6.4 per cent since June 2018. The benchmark price for townhomes in Metro Vancouver have increased 1.3 per cent since December 2017 and have decreased 5.3 per cent over the last six months.
 
REBGV reports that residential home sales in the region totalled 1,072 in December 2018, a 46.8 per cent decrease from the 2,016 sales recorded in December 2017, and a 33.3 per cent decrease from November 2018 when 1,608 homes sold.
 
Last month’s sales were 43.3 per cent below the 10-year December sales average. There were 1,407 detached, attached and apartment homes newly listed for sale on the MLS® in Metro Vancouver in December 2018. This represents a 25.6 per cent decrease compared to the 1,891 homes listed in December 2017 and a 59.3 per cent decrease compared to November 2018 when 3,461 homes were listed.
 
 
The total number of homes currently listed for sale on the MLS® system in Metro Vancouver is 10,275, a 47.7 per cent increase compared to December 2017 (6,958) and a 16.5 per cent decrease compared to November 2018 (12,307).
 
 
Read
Categories:   Annieville, N. Delta Real Estate | Beach Grove, Tsawwassen Real Estate | Big Bend, Burnaby South Real Estate | Boulevard, North Vancouver Real Estate | Bowen Island, Bowen Island Real Estate | Boyd Park, Richmond Real Estate | Brentwood Park, Burnaby North Real Estate | Bridgeport RI, Richmond Real Estate | Brighouse South, Richmond Real Estate | Brighouse, Richmond Real Estate | Burnaby Hospital, Burnaby South Real Estate | Cambie, Vancouver West Real Estate | Caulfeild, West Vancouver Real Estate | Champlain Heights, Vancouver East Real Estate | Chilliwack E Young-Yale, Chilliwack Real Estate | Clayton, Cloverdale Real Estate | Cloverdale BC, Cloverdale Real Estate | Collingwood VE, Vancouver East Real Estate | Coquitlam West, Coquitlam Real Estate | Deep Cove, North Vancouver Real Estate | Downtown VW, Vancouver West | Downtown VW, Vancouver West Real Estate | East Cambie, Richmond Real Estate | East Richmond, Richmond Real Estate | English Bluff, Tsawwassen Real Estate | Fairview VW, Vancouver West | Fairview VW, Vancouver West Real Estate | False Creek North Real Estate | False Creek North, Vancouver West Real Estate | False Creek, Vancouver West Real Estate | Fraser VE, Vancouver East Real Estate | Fraserview VE, Vancouver East Real Estate | Gilmore, Richmond Real Estate | Grandview Woodland, Vancouver East Real Estate | Guildford, North Surrey Real Estate | Hastings, Vancouver East Real Estate | Hawthorne, Ladner Real Estate | Heritage Woods PM, Port Moody Real Estate | Indian River, North Vancouver Real Estate | Ironwood, Richmond Real Estate | Killarney VE, Vancouver East Real Estate | Kitsilano, Vancouver West | Kitsilano, Vancouver West Real Estate | Knight, Vancouver East Real Estate | Ladner Elementary, Ladner Real Estate | Langley City, Langley Real Estate | Lower Lonsdale, North Vancouver Real Estate | Main, Vancouver East Real Estate | Marpole, Vancouver West Real Estate | McLennan North, Richmond Real Estate | Morgan Creek, South Surrey White Rock Real Estate | Mount Pleasant VE, Vancouver East | Mount Pleasant VE, Vancouver East Real Estate | Mount Pleasant VW, Vancouver West Real Estate | New Westminster Real Estate | Point Grey, Vancouver West Real Estate | Queen Mary Park Surrey, Surrey Real Estate | Queensborough, New Westminster Real Estate | Quilchena, Vancouver West Real Estate | Renfrew VE, Vancouver East Real Estate | Riverdale RI, Richmond Real Estate | Sardis West Vedder Rd, Sardis Real Estate | Seafair, Richmond Real Estate | Seymour, North Vancouver Real Estate | South Cambie, Vancouver West Real Estate | South Granville, Vancouver West Real Estate | South Marine, Vancouver East Real Estate | South Slope, Burnaby South Real Estate | South Vancouver, Vancouver East Real Estate | Steveston North, Richmond Real Estate | Steveston South, Richmond Real Estate | Strathcona, Vancouver East Real Estate | Sullivan Station, Surrey Real Estate | Sunshine Hills Woods, N. Delta Real Estate | Surrey Real Estate | Tsawwassen Central, Tsawwassen Real Estate | Tsawwassen East, Tsawwassen Real Estate | University VW, Vancouver West Real Estate | Uptown NW, New Westminster Real Estate | Vancouver Market Report | Vancouver Real Estate | Victoria VE, Vancouver East Real Estate | West Cambie, Richmond Real Estate | West End VW Real Estate | West End VW, Vancouver West Real Estate | West Newton, Surrey | West Newton, Surrey Real Estate | Whalley, North Surrey Real Estate | White Rock, South Surrey White Rock Real Estate | Woodwards, Richmond Real Estate | Yaletown, Vancouver West Real Estate
Reciprocity Logo The data relating to real estate on this website comes in part from the MLS® Reciprocity program of either the Greater Vancouver REALTORS® (GVR), the Fraser Valley Real Estate Board (FVREB) or the Chilliwack and District Real Estate Board (CADREB). Real estate listings held by participating real estate firms are marked with the MLS® logo and detailed information about the listing includes the name of the listing agent. This representation is based in whole or part on data generated by either the GVR, the FVREB or the CADREB which assumes no responsibility for its accuracy. The materials contained on this page may not be reproduced without the express written consent of either the GVR, the FVREB or the CADREB.